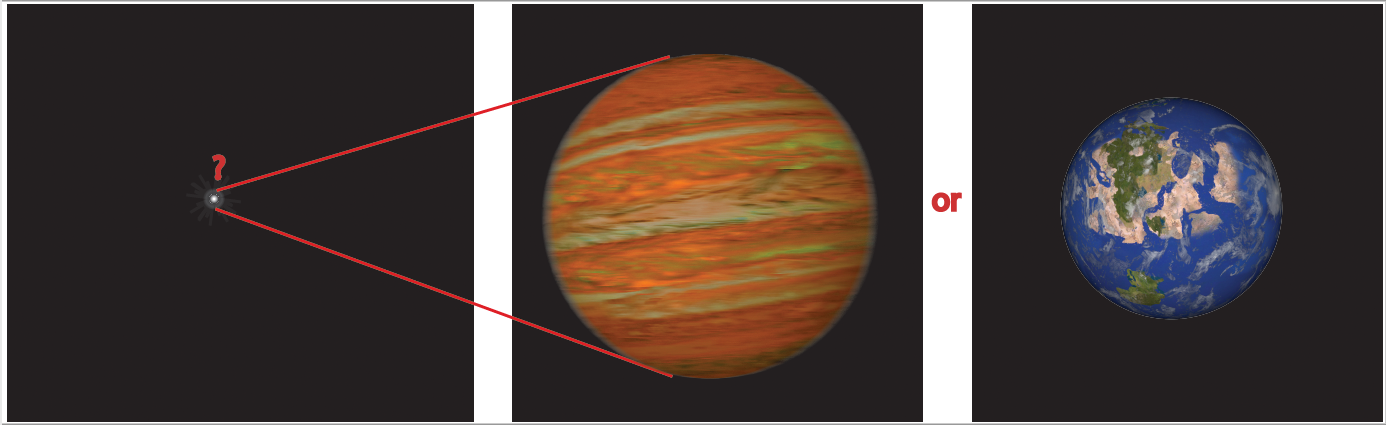
Imaged terrestrial and giant exoplanets occupy a single pixel in our images. That single pixel holds all the information about the atmosphere (and possible surface) of these exotic worlds.
Discovering Earth 2.0, another planet like our Earth that could host life on its surface, requires us to characterize the atmosphere of the planet. An important feature we need to study is the clouds in that atmosphere. What are they made of? How are they positioned across the globe and what is their vertical extent? The answers to these questions will help us determine if the climate of the planet is hospitable to life.
But how could we learn anything about the clouds of another planet when all we have is a single pixel on an image, and there is no telescope that can resolve the planetary disk? The solution comes from observing the giant planets of our solar system, like Jupiter, with “the worst camera possible”, one that brings the whole of Jupiter down to a single pixel. As Jupiter rotates around its axis, we can see the amount of light we receive from Jupiter changing due to clouds in the atmosphere. When, for example, the Great Red Spot is visible we receive more light from Jupiter, and when the spot is on the non-visible side we receive less light. The total amount of light received as a function of the planetary rotation, the so-called light curve, gives us thus information about the cloud coverage of the planetary atmosphere.
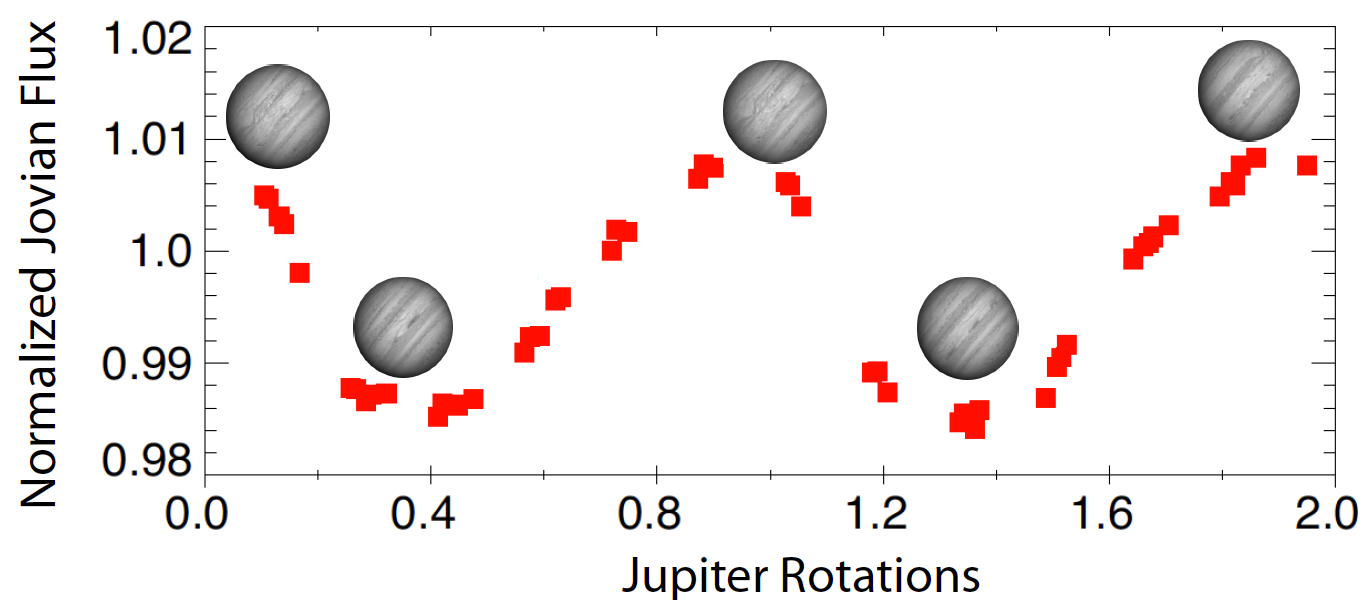
As Jupiter rotates around its axis, we can see the amount of light we receive from Jupiter changing due to clouds (like, for example, the Great Red Spot) in the Jovian atmosphere.
Here at the Steward Observatory, we have created a mapping technique that can use the light curve of an observed target to create the map of its atmosphere. We have tested our code on the Jovian light curve and could reproduce the non-rotationally symmetric features of Jupiter in our maps. Knowing that our mapping technique works, we have already applied it to a handful of light curves of brown dwarfs to create maps of some first exo-atmospheres.
Brown dwarfs are the link between the lowest mass stars (M stars) and (exo)planets. Brown dwarfs don’t have enough mass to sustain nuclear fusion and they spend their lives cooling down, like planets. Brown dwarfs offer ideal targets for us to map, since they cover a large range of temperatures and masses; have a wealth of clouds in their atmospheres; and usually lack a parent star that blinds us, making their mapping easier than that of exoplanets.
Luhman 16 is a brown dwarf binary consisting of two brown dwarfs (A and B) that both show light curve variability due to clouds in their atmospheres. Using observations of Luhman 16A and B with the Hubble Space Telescope, we have mapped the atmosphere of B in one day in 2013 and one day in 2014, and of A in one day in 2014. Our maps show large cloud patches in the atmospheres of A and B that cover between 20% and 40% of their atmospheres (see, for example, the movie here). The atmosphere of Luhman 16B is so dynamic that the atmosphere, and our map, changed within one day on Luhman 16B (which only takes 5 hours!). Using our maps we retrieved an upper limit for the wind speeds on Luhman 16B’s atmosphere to be of the order of 1800 mph! These wind speeds are 7 times larger than the maximum wind speed ever recorded on Earth, and 3 to 5 times larger than the wind speeds met in the giant planets of our Solar System (~340mph for Jupiter, or ~670mph for Neptune)!
Even though the atmosphere of Luhman 16B changes within one 16B day, a careful inspection of a number of published light curves showed that there is one feature that reappears in the atmosphere after hundreds, or even thousands of 16B days. We excluded the possibility that this is related to an exoplanet, and concluded that it is an atmospheric feature of 16B. Could it be a feature similar to Neptune’s Great Dark Spots that appear, live their lives and disappear; only to be replaced by another Dark Spot later? Future observations of Luhman 16B over multiple rotations could help us understand the nature of this intriguing feature.
Currently we apply our mapping technique to observations of more brown dwarfs in an effort to better understand their cloudy, dynamic atmospheres. The experience we get in the process will be valuable for mapping imaged giant exoplanets, like the ones Kevin presented, currently and, hopefully in the not-so-far future, Earth 2.0!